Tom DeMarco wrote “You can’t control what you cannot measure”. If test automation has always been actively discussed, the returns of automated tests were usually described in a very general way. There have been so far very few methodologies that can provide you with unbiased assessment of your software testing automation process. This article proposes some of methods to define test automation key performance indicator (KPI).
Author: Dmitry Tishchenko, A1QA, http://a1qa.com
The emphasis in proposed metrics is made upon two points: cost difference and duration difference
Cost difference. The final costs of automated tests should be lower than those of manual software testing. If you know the frequency of builds and the economy rate, it is then possible to forecast when the efforts create value. A tester will be able to spend time to cover with manual tests more sophisticated project part. With automated tests, a testing team is able to deal with a bigger scope.
The cost difference is represented by Return on investment (ROI) metrics calculated using a well-known formula: ROI = benefits/costs, where the costs are the expenses for test development, execution and support; and the benefits are the savings of replaced testing efforts. In practice, assuming that software releases are produced 4 times per week, the ROI is gained in 3-4 months if the coverage is chosen correctly.
Duration difference. Testing cycle duration in automation must be shorter than in manual testing and that is why the results are gained sooner. This decreases the scope of the testing and development cycles and accelerates Time-to-market. Test automation is also a great advantage as it shortens the regression cycle, when hot fixes or patches need to be applied to a production platform.
The Duration difference is represented by metrics showing duration value per build/release cycle/time-to-market. If you can measure the damage from downtime of the productive environment after the roll out of patches and new releases, the benefit of the test duration can be easily calculated.
We went through the main test automation advantages and their business values. Still, there are other things that can prove the efficiency of test automation.
Among the main process components (like environment setup, scope selection and test execution) we chose those that run constantly and define the success of test automation:
- Automated test development
- Automated test support
- Test run and result analysis
Let’s start with those necessary for Automated test development
Automated test coverage (automated tests vs. manual tests) reflects the correlation of automated and non-automated tests. This metric has more administrative approach than one describing the process specifics. Though used along with other metrics, it gives quite informative and transparent activity overview.
Cost per automated test. Applying the metric you will see that the price per one automated test decreases. The tendency of cost reduction is of the consequence of two main factors: 1) Automation solution – efficient architecture allows software engineers to reuse the code. 2) Human factor- people eventually start working faster after learning the system under test.
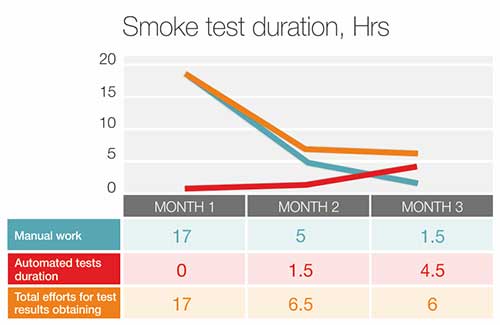
Earlier, I mentioned the Time to Market parameter, which is important for efficiency evaluation. This factor is closely connected to Test run and result analysis. You may apply this metric to analyze the time required for testing results of particular scope – smoke test for instance.

The diagram illustrates the decrease of mentioned time from 17 to 6 hours. That is how actually test automation works. You can also notice that the time of manual work and running tests with negative results decreases too.
Describing the essence of Automated test support one should say that the main metrics here depend upon the test support expenses and actual number of tests. When you start applying test automation you will see that the expenses grow slower than the number of tests. That is visible evidence of test automation effectiveness in the right test coverage.
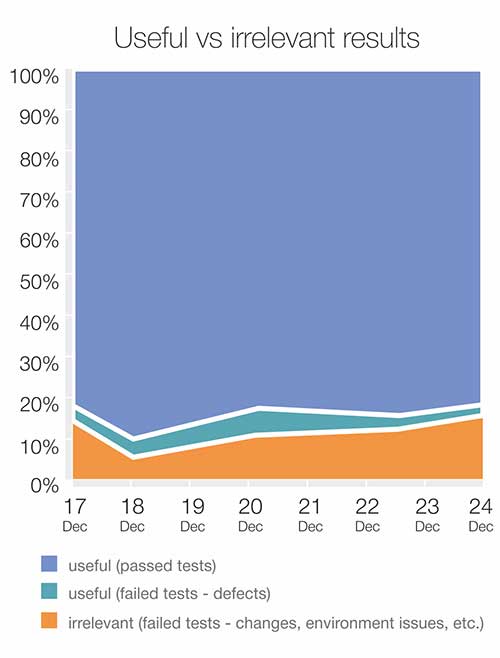
The next range of metrics shows the index of cost adequacy. In fact, when the test coverage is chosen correctly the workload will never be excessive. These are complex metrics that describe the correlation between useful and irrelevant results.
- Useful results: test passes or test failures caused by a defect.
- Irrelevant results: test failures due to problems with the environment, data-related issues, changes in application (business logic and/or interface).
The irrelevant results are those that decrease automation efficiency in terms of duration and economy factors. The acceptable percentage of irrelevant results depends upon the project, though 10%-20% can be used as a basic level.

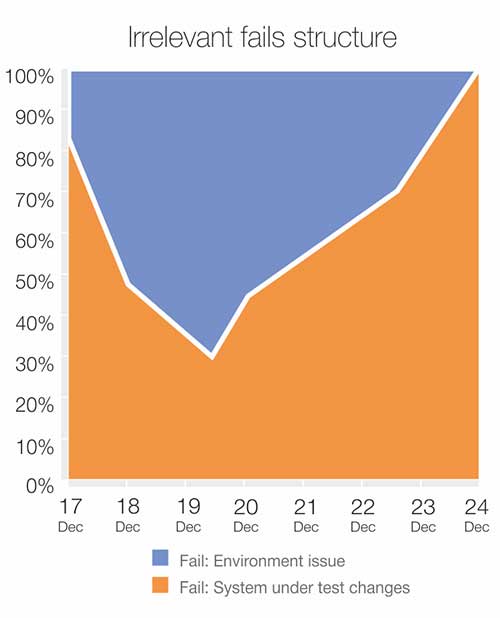
If the irrelevant results` rate exceeds an acceptable level you should find the source of the problem. In the diagram below you can see that a part of useless results were related to environment issues. After the environment stabilization, the overall situation was finally corrected, while the useless test results were related mostly to the changes made in application.

In a nutshell, being aware of the automation process specifics and the methods of efficiency evaluation, you have the basic info necessary for tracking the process of automating your software testing. You are able to find the reasons of your automation project success, and understand what and why went wrong.
About the author
Dmitry Tishchenko is a software testing specialist with over a decade experience in business leadership. At A1QA he is responsible for KPI optimization and business process automation. With his profound expertise, Dmitry guides the clients through the implementation and working process optimization. Dmitry Tishchenko is the author of several articles on test automation process, where he covers the details the pros and cons of testing workflow. He also holds a B.Sc. degree in software engineering.

