Understanding the internals of web apps and their behavior inside the browser is important for the software testers. In this article Dmitriy Radchenko explains to us how the features of Chrome Developer Tools can be used for our web software testing and quality assurance activities, especially for performance analysis and understanding JavaScript execution inside the browser.
Author: Dmitriy Radchenko, QA Team Lead, TestMatick, http://testmatick.com/
Chrome Developer Tools (or Chrome DevTools) is a free tool which gives you a possibility to browse web content on the Google Chrome browser, track the bugs and also fix these bugs.
There are many ways to open the Developer Tools:
- Press the F12 key;
- Press a key combination of Ctrl + Shift + I;
- Make right-click on the element of the page>view page source
- Browser menu>More tools>Developer tools
You can choose Developer Tools features in the Settings area. It consists of eight tabs which provide different ways to analyze, understand and modify the website behavior:
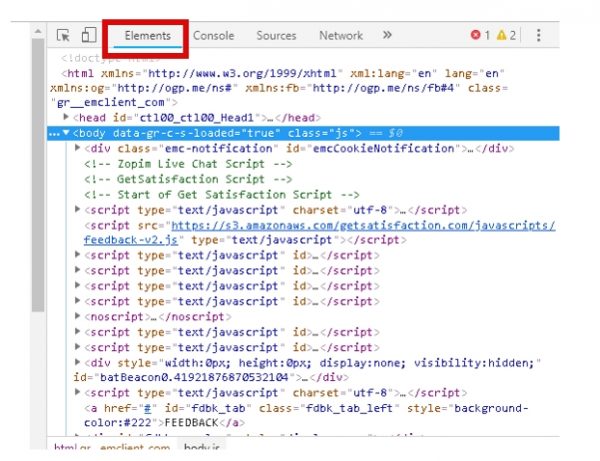
1. Elements – has the whole HTML/CSS code of a page
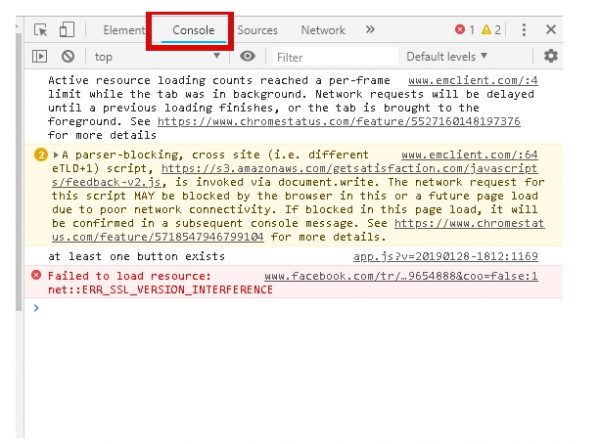
2. Console – shows errors in a code
3. Sources – allows you to perform operations with a code
4. Network – tracks the queries execution
5. Timeline – measures the time of page loading
6. Profiles – allows you to create JavaScript, CPU profiles
7. Resources – allows you to browse particular data
8. Audits – checks particular parameters
Let’s analyze every tab more thoroughly.
Elements Tab
After opening the Elements tab, you can see the page layout and also change a site content by changing its HTML and CSS code.
It opens two windows (the left one is for the HTML document and the right one for the CSS) where you can change a structure and styles of the opened web page. For example, there is a possibility to change the text on the page by editing the content of its HTML body and also to change fonts if you modify their values in the CSS window. These manipulations will not save the changes but just help to tentatively evaluate all possible modifications. You can also view the code of a particular page element by making a right-click on the element and choosing the “View code” command.
A phone icon in the Elements panel opens the window where you can change the screen size and also choose a particular device by clicking on the Select Model button. This allows us to see how the page will look on different devices.
Console Tab
This tab is the most popular for testers as it shows you where the errors in a code which were found during script execution. In the “Errors”, the location of errors is displayed and after clicking on one of them you will move to the “Sources” tab where the error will be displayed in a general page structure. Also, you can see there different deprecations and recommendations.
A crossed circle icon will clear the field of the Console tab. You can also filter the messages in the console according to various criteria.
Sources Tab
You can debug the code in this tab. It consists of three windows:
1. A zone of source files. All files connected to the page including JavaScript and CSS are here.
2. Text zone. A text is displayed here.
3. Zone of information and control.
In the zone of source files, you can choose a necessary element, in the text zone perform its debugging and in the information and control zone run/stop a well-established code.
Network Tab
The main task of this tab is to record a weblog. It displays the requested and loaded resources in a real-time mode. You can define what resources need the most time to be loaded and processed for following page optimization. Also, you can see here the queries which are sent to a server and also responses which are delivered from it with the help of the Large requests rows mode.
Timeline Tab
This tab is used for a complete overview of time spent: what the time was spent on and how many time was needed for every process. The whole activity including resources load and JavaScript execution is displayed here.
Profiles Tab
This tab allows profiling the memory usage by a web application or page, helping to track where many resources are spent and how to optimize the code.
- CPU profiler – displays the information according to the time spent on JavaScript execution;
- Heap profiler – displays the memory allocation;
- JavaScript profile – displays what was the time for scripts execution spent on.
Resources Tab
This tab is used to inspect loaded elements. It gives a possibility to interact with HTML5, Database, Local Storage, Cookies, AppCache, etc. You can also clear the cookies in this tab by clicking the crossed circle icon.
Audits Tab
This tab is used as a page analyzer in the process of its loading. It provides an analysis report and recommendations on page load optimization to increase speed.
Security Tab
The security panel displays the information about every query and highlights those that explain why a website doesn’t get a wished green icon in its status. Moreover, you can get the information about certification checking, whether a site verified its authenticity by TSL certificate; about TSL connection, showing whether your site uses modern secure protocols; about the security of loaded secondary sources.
Conclusion
As you can understand with all the features provided by this tool, the Chrome Developer Tools is a very useful thing people working in a software testing company. The complete Chrome Developer Tools documentation for can be found on https://developers.google.com/web/tools/chrome-devtools/.
About the author
Dmitriy Radchenko is QA Team Lead at TestMatick. He is experienced in testing web-based applications (including SaaS-based applications), content management systems, databases as well as mobile-based client-server applications on major platforms like iOS & Android.


